Skip to content

Projects

Security and applied-ML tools I designed, shipped and measured end to end — from supply-chain defence and phishing detection to vulnerability triage, mobile hardening and high-availability cloud infrastructure.

SlopGuard

Pre-install supply-chain guard that catches AI-hallucinated, typosquatted and malicious dependencies — zero runtime deps.

Role
Sole author — architecture, detection engine, CLI, CI integrations and SaaS.
Context
Slopsquatting is an emerging supply-chain threat documented in USENIX Security 2025: LLMs frequently recommend `pip install` or `npm install` of packages that do not exist — roughly 20% of AI-suggested packages are hallucinated, with ~38% being near-misses on real package names. Attackers monitor LLM outputs and pre-register those hallucinated names with malicious payloads.

Problem

There was no pre-install interception layer that could deterministically evaluate a package's legitimacy — checking typosquatting distance, publication age, download velocity, OSV threat intelligence and LLM hallucination likelihood — before any code executes on the developer's machine.

Approach

  • 5-layer detection engine (layers 0–4) that scores packages without executing any of their code.
  • Ecosystem-agnostic core with pluggable adapters for PyPI and npm.
  • Multiple frontends covering every integration point: CLI, pre-commit hook, GitHub Action and self-hostable SaaS.
  • Provable anti-false-positive invariant: the opt-in LLM hallucination layer is structurally unable to block a legitimate package on its own.

Impact

  • Catches malicious and hallucinated packages before installation — zero runtime dependencies shipped to consumer environments.
  • Test suite of 2687 collected tests (including parametrized) enforces correctness at every detection layer with a CI gate of ≥90% global coverage and ≥95% on critical paths.
  • 8 import-linter architecture contracts prevent cross-boundary coupling as the codebase grows.
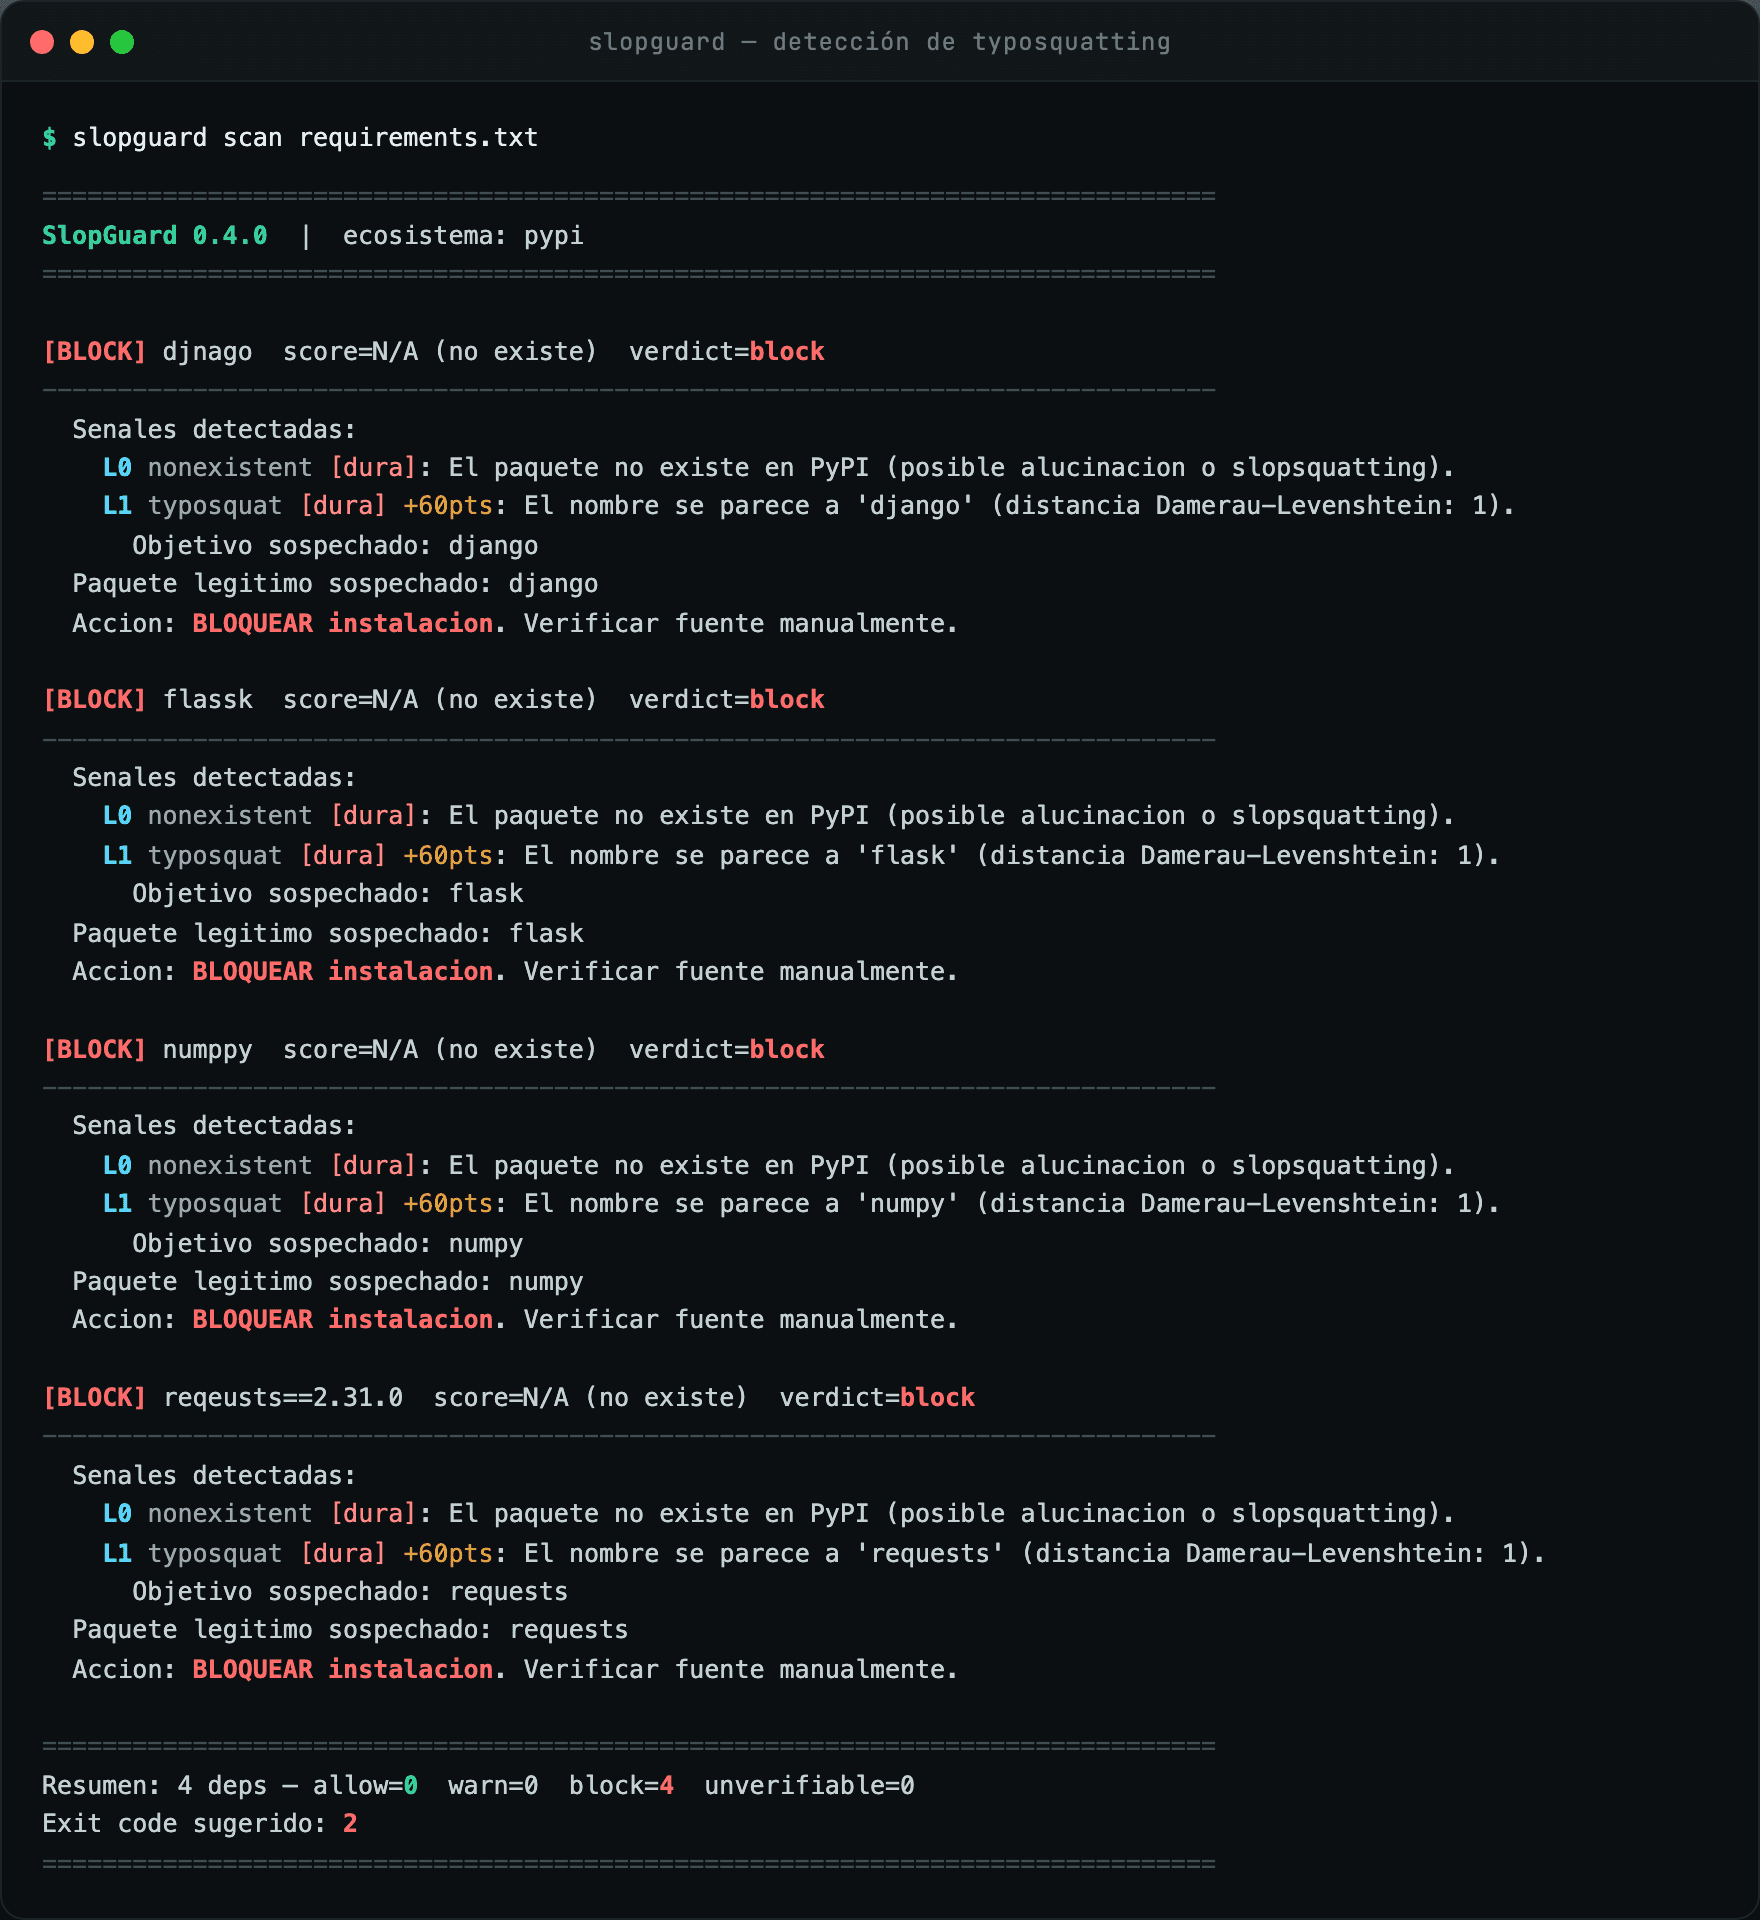
  • SlopGuard CLI blocking four typosquatted PyPI packages, showing Damerau-Levenshtein matches and a suggested exit code 2.
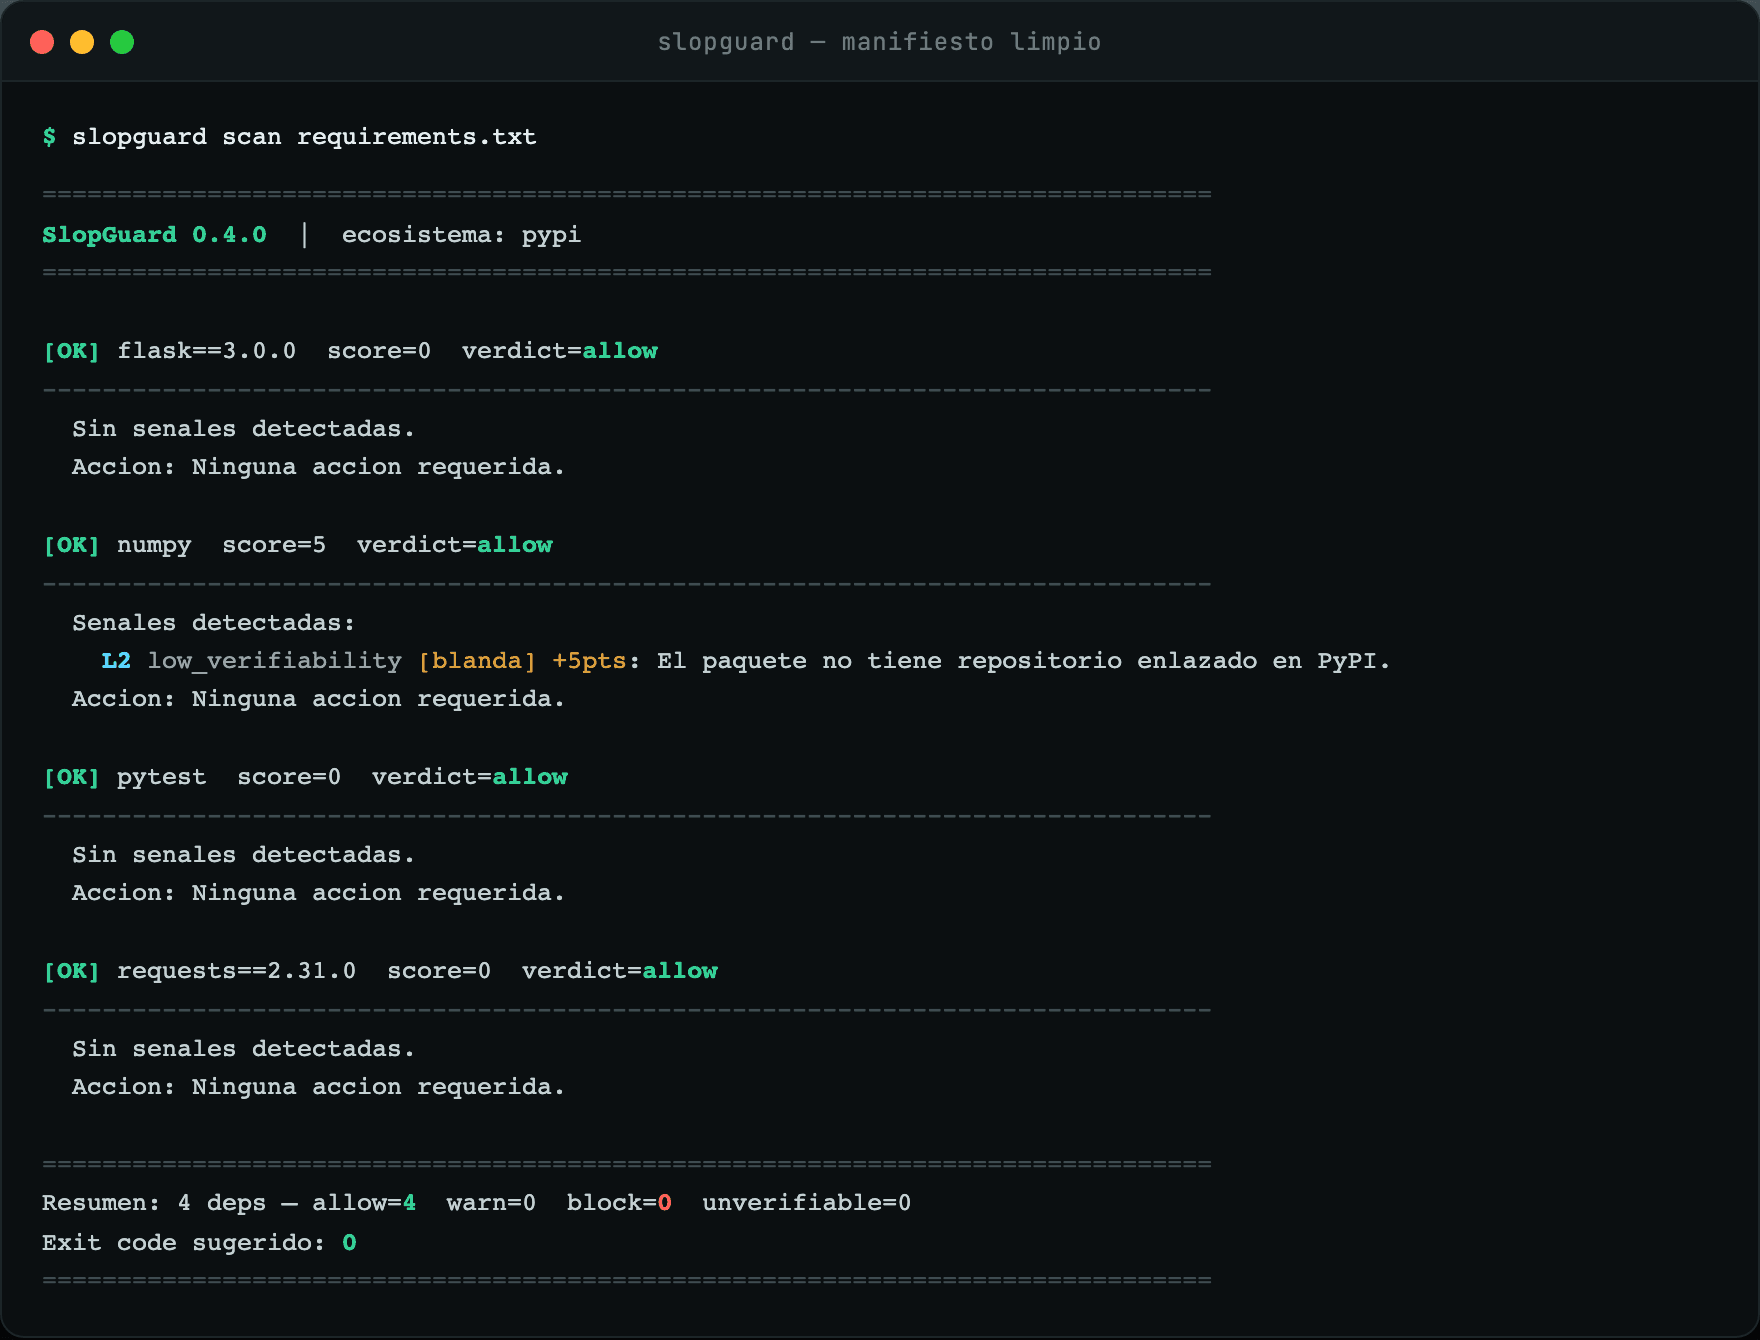
  • SlopGuard CLI scanning a clean manifest — all four dependencies allowed, exit code 0 (no false positives).
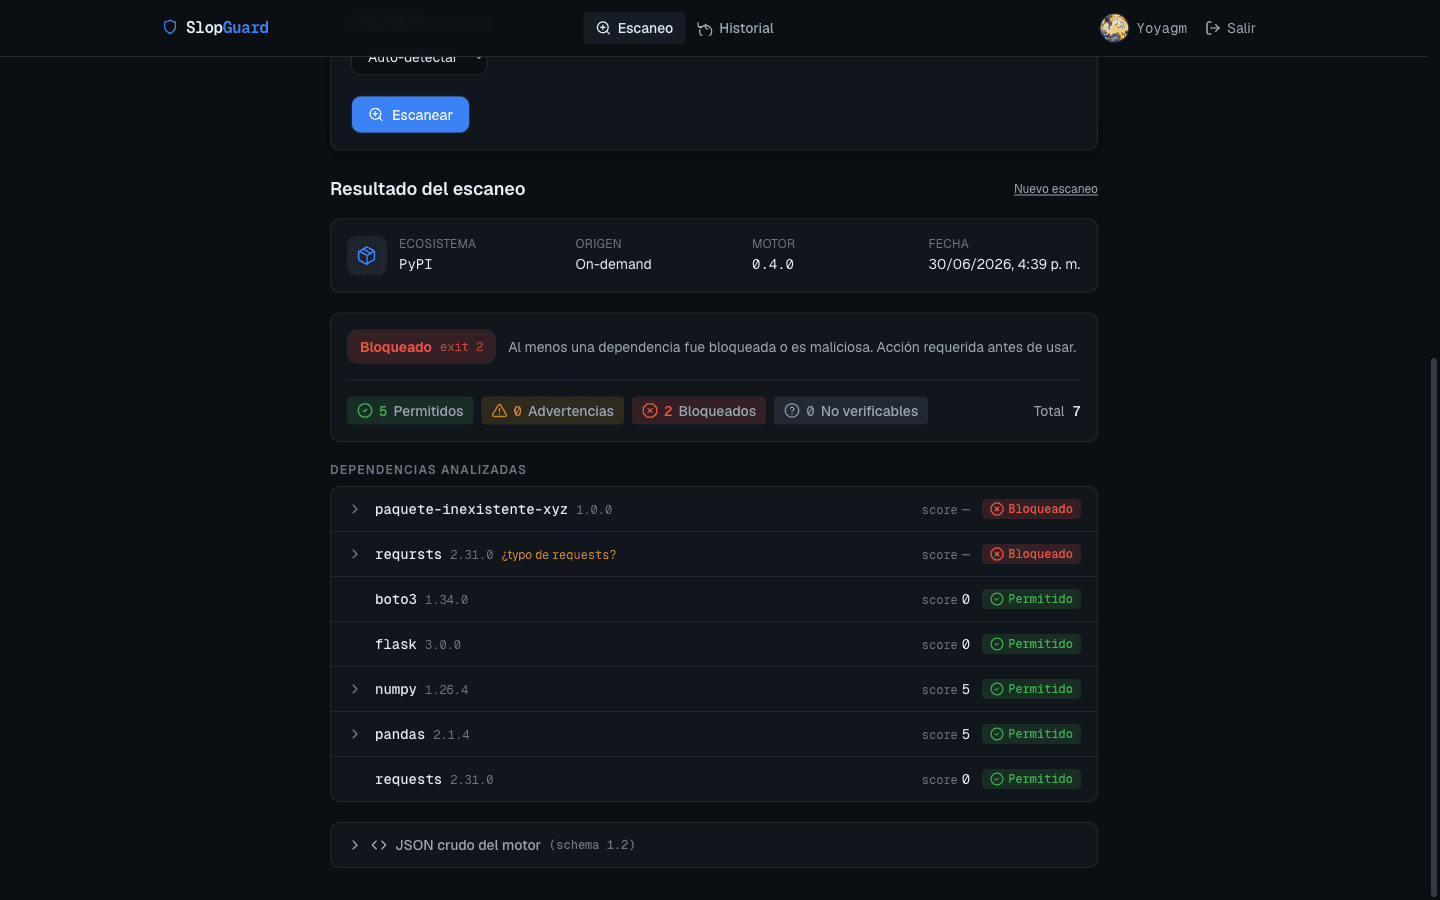
  • SlopGuard SaaS scan report for a PyPI manifest — global verdict Blocked (exit 2): 5 dependencies allowed and 2 blocked (a nonexistent/hallucinated package and the 'reqursts' typosquat of requests).
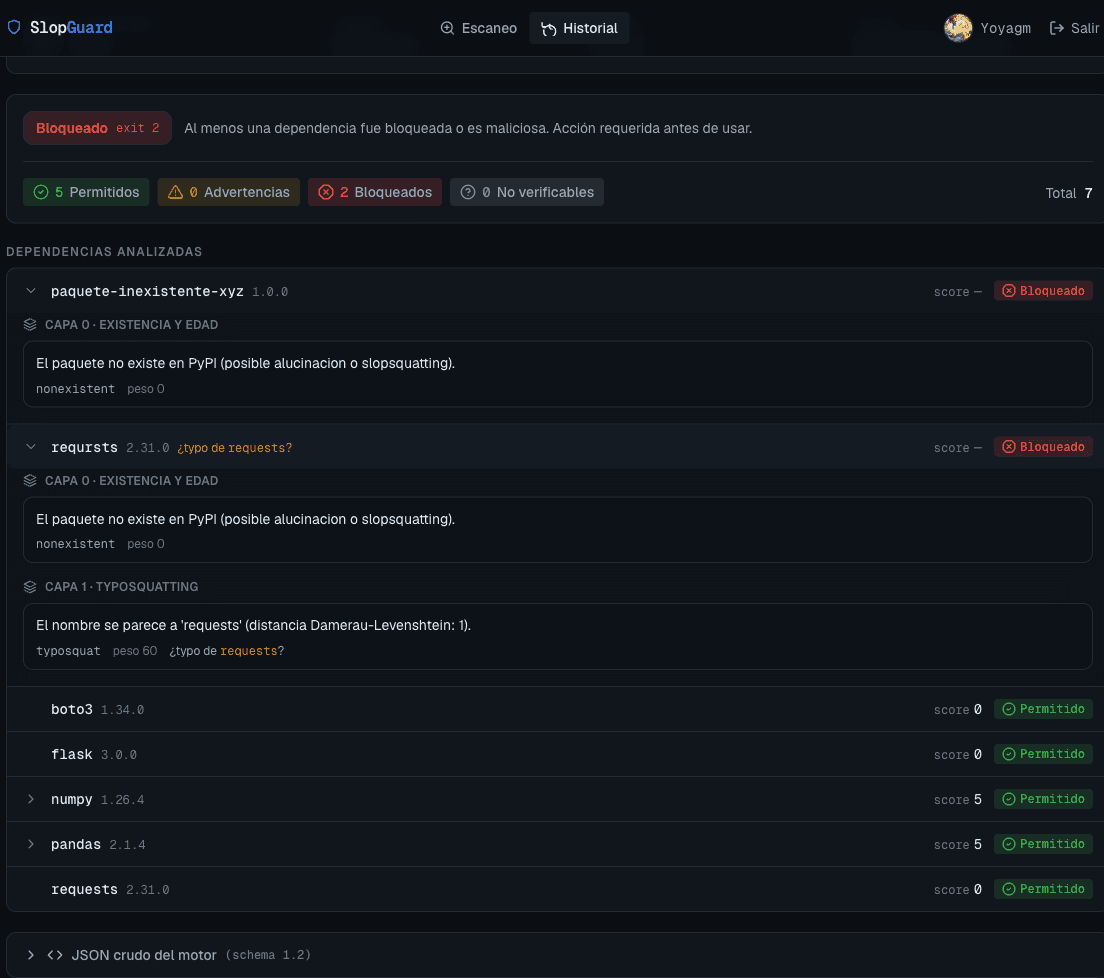
  • SlopGuard scan detail with expanded detection signals — Layer 0 (package absent from PyPI, possible hallucination) and Layer 1 typosquatting (Damerau-Levenshtein distance 1 to 'requests').
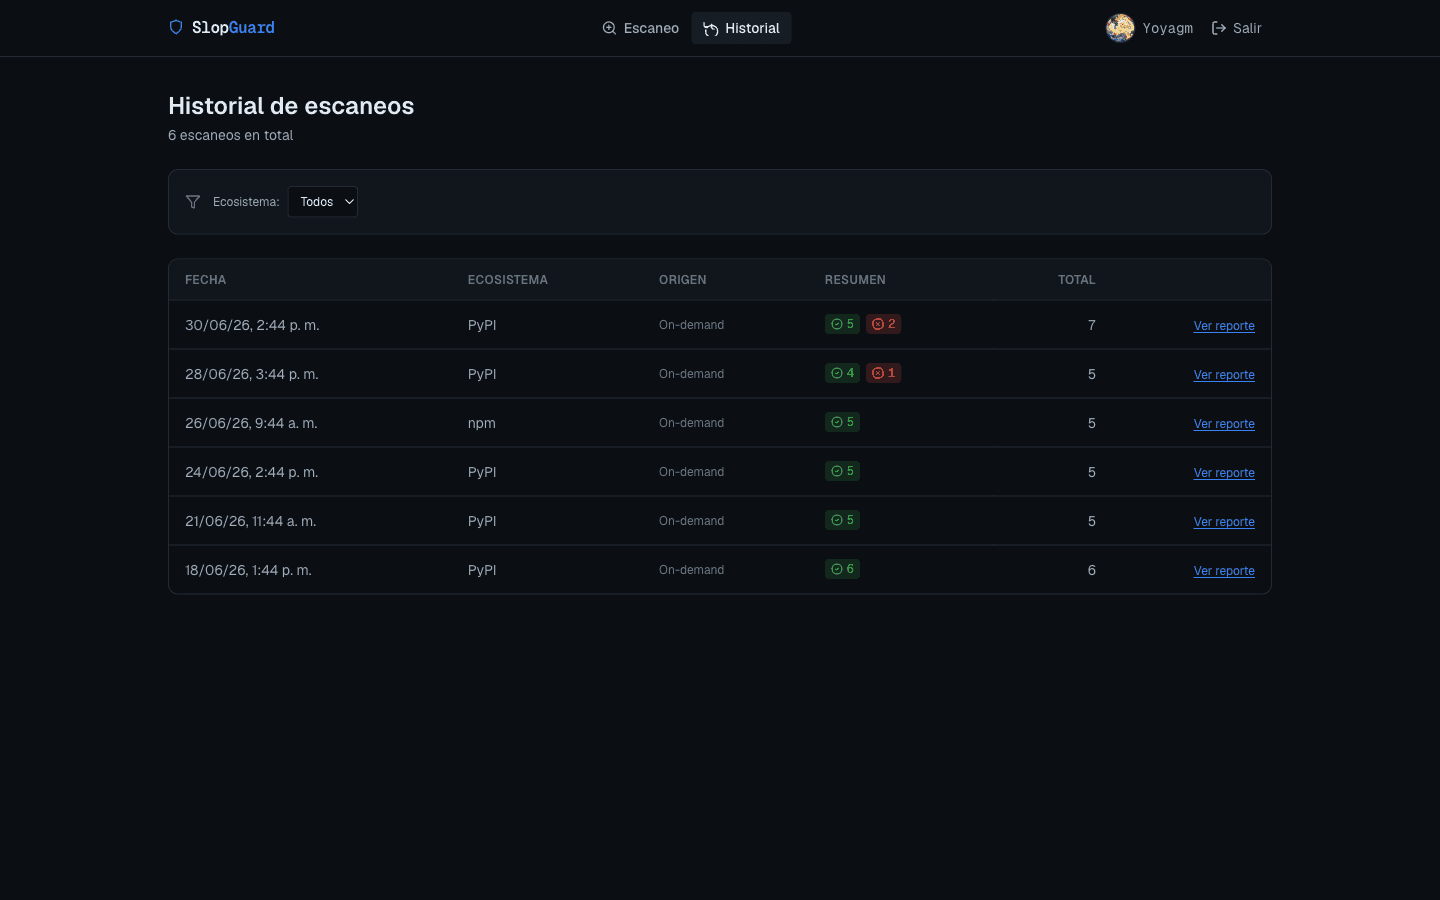
  • SlopGuard SaaS scan history — six on-demand scans across PyPI and npm, each with an allow/block summary, total dependency count and ecosystem filtering.
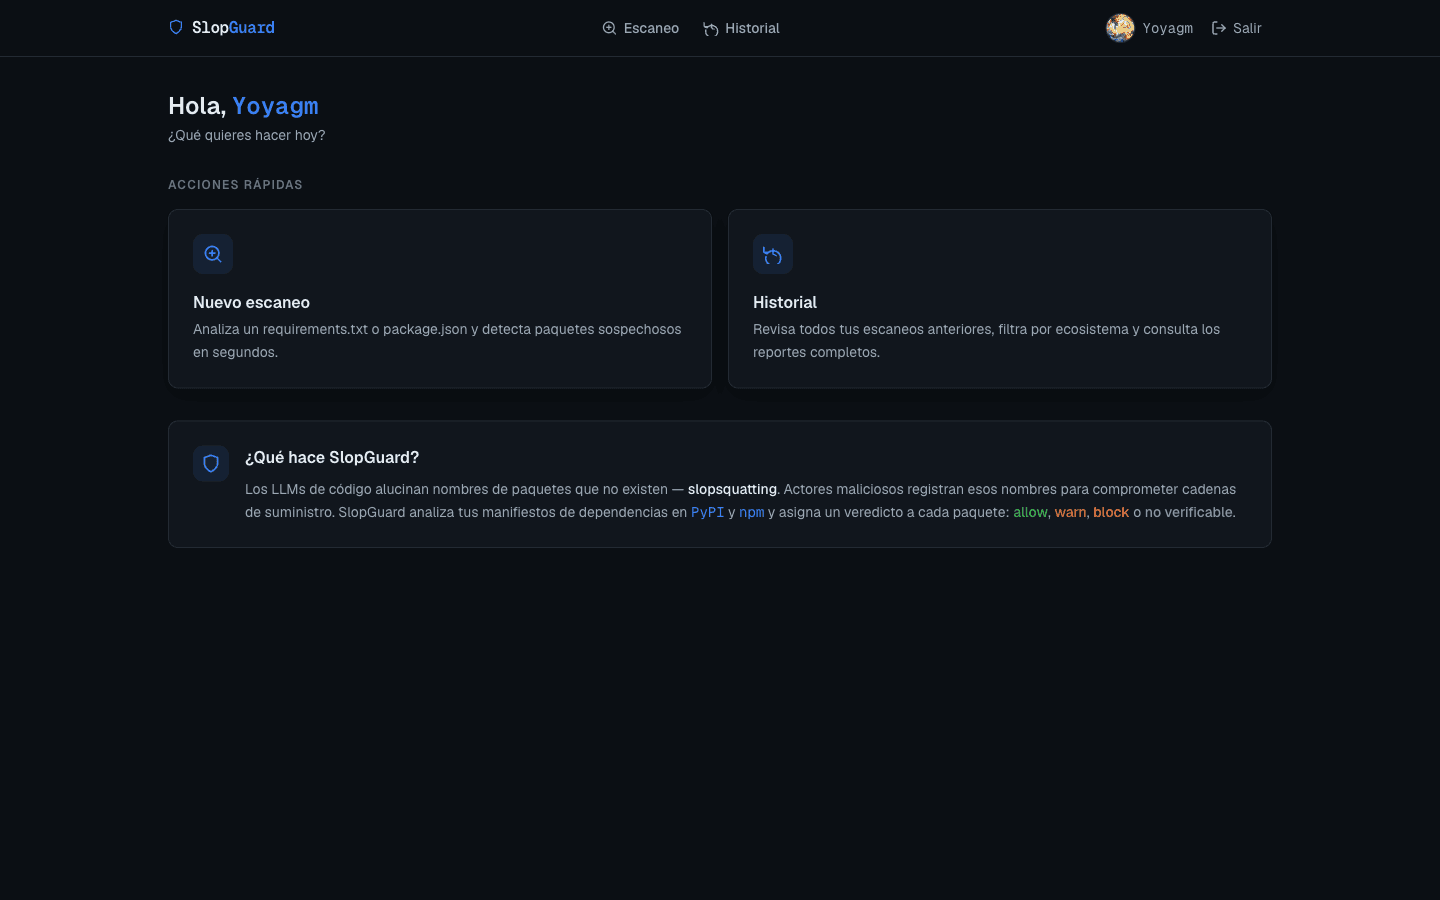
  • SlopGuard SaaS dashboard — quick actions (new scan, history) and an explainer of slopsquatting and the allow / warn / block verdict model for PyPI and npm.
0runtime dependencies
5detection layers
2ecosystems (PyPI + npm)
~96%test coverage
2687tests collected
8architecture contracts
  • Layered scoring with provable anti-false-positive invariantImplementedSecurity
  • OSV.dev threat-intel with fail-closed degradationImplementedSecurity
  • Opt-in LLM hallucination layer, structurally unable to block legitimate packagesImplementedSecurity
  • Deterministic, network-free typosquatting detection (Damerau-Levenshtein + Jaro-Winkler)ImplementedSecurity

Stack

  • Python 3.11+
  • stdlib only
  • mypy strict
  • ruff (bandit)
  • import-linter
  • pytest
  • GitHub Actions
  • CodeQL
  • FastAPI
  • Next.js
  • PostgreSQL
  • Redis

Phishing URL Detector

Explainable phishing detection whose headline result is that the benchmark everyone reports 99 %+ on is broken — plus an honest baseline and exact TreeSHAP running in the browser.

Role
Sole author — leak audit, feature engineering, evaluation design, TreeSHAP port to JavaScript, service and written report.
Context
Published work on phishing-URL classification routinely reports 99–100 % accuracy on public datasets, and those numbers are not reproducible in the field. PhiUSIIL (UCI id 967, 235,795 URLs) is the most widely cited recent dataset, so it is where the gap between the literature and reality is most worth measuring.

Problem

Nobody had quantified why those results fail to transfer. Auditing the raw file first — instead of training on it — was the only way to separate what the model learns from what the dataset leaks, and then to state a number that survives contact with phishing collected after the training data.

Approach

  • Leak audit before any training: two independent label leaks measured on the raw file. `URLSimilarityIndex` equals exactly 100.000 in 134,850 of 134,850 legitimate rows, and the legitimate class is a collection artefact — 100 % `https://www.`, 0.00 % with a path, a query or an `@`.
  • Every precomputed column discarded; the model trains only on the canonicalised host name. A guard test mutates the scheme, path, query, port and `www.` prefix and asserts the feature vector is bit-identical — with a negative control that plants a leak, because a guard that cannot fail is worthless.
  • Splitting grouped by registrable domain (eTLD+1, ICANN section of the Public Suffix List) so no domain lands on both sides. Hosting suffixes are deliberately not used as grouping keys — that would reward memorising a provider — and are exposed as a feature instead.
  • Out-of-distribution and temporal evaluation: Tranco top-1M as benign, PhishTank hosts submitted after the cutoff as phishing, OpenPhish's live feed as an independent probe. Three contaminations removed and counted, each of which would otherwise flatter the result.
  • Exact path-dependent TreeSHAP reimplemented in dependency-free JavaScript so the demo explains its own verdict with no backend, parity-tested at 1e-12 against the Python reference.

Impact

  • The leak is quantified, not asserted: a one-line rule scores 99.67 % accuracy, and hand-rolled lexical features on the raw URL — the obvious rescue after throwing the tainted columns away — still score 99.51 % while measuring nothing.
  • The honest number, against phishing submitted two years after the training data: ROC-AUC 0.937 and 70.5 % recall at a 1 % false-positive rate.
  • Operating point tuned from the ROC instead of the default 0.5: false positives drop 13,453 → 999, a 92.6 % reduction, for 18 points of recall. The tradeoff is published, not hidden.
  • Shipped twice over: a zero-cost static demo on GitHub Pages that scores and explains in the browser, and a containerised FastAPI service with batch scoring and a model-introspection endpoint.
  • The live demo scoring a brand-impersonation host at 99.9 % phishing, with the per-feature SHAP contributions that produced the verdict listed underneath.
  • Leak 1: the distribution of URLSimilarityIndex, pinned at exactly 100.000 for every one of the 134,850 legitimate rows — a one-line rule that scores 99.67 % accuracy.
  • Leak 2: structural profile of both classes. Every legitimate URL is https://www.<domain> with no path, no query and no @ — the legitimate rows were normalised at collection time, the phishing rows were not.
  • ROC and precision-recall curves for both evaluation regimes: the internal grouped hold-out and the out-of-distribution temporal test, with the 1 % false-positive operating point marked.
  • Global SHAP importance across the 51 host-only features, led by brand_in_subdomain_only — the classic impersonation shape where a brand appears in the subdomain but not in the registrable domain.
0.937ROC-AUC (OOD + temporal)
70.5%recall at 1 % FPR
99.67%accuracy of the one-line leak
92.6%false positives removed
8.9e-16max SHAP delta Python ↔ JS
113tests
  • Leakage guard test with a planted-leak negative controlImplementedResilience
  • Grouped split by eTLD+1 and post-cutoff temporal evaluationImplementedResilience
  • MITRE ATT&CK mapping (T1566 / T1566.002) with detection-as-codeImplementedSecurity
  • `feature_spec_sha256` refuses to score on train/serve skewImplementedResilience
  • Exact TreeSHAP in the browser — no backend, no telemetryImplementedUX
  • Containerised FastAPI scoring service (single, batch, model introspection)ImplementedResilience

Stack

  • Python 3.12
  • LightGBM
  • scikit-learn
  • SHAP
  • FastAPI
  • Docker
  • JavaScript (zero deps)
  • GitHub Pages
  • pytest
  • LaTeX

Vulnerability Prioritisation Dashboard

Which vulnerability do you patch first? CISA KEV + EPSS + NVD — and a measurement showing the EPSS advantage everyone quotes is mostly evaluation artefact.

Role
Sole author — ingestion pipeline, metric design, the prospective evaluation, dashboard and five architecture decision records.
Context
Every security team has more CVEs than remediation capacity, so the queue order is the whole decision. The industry answer is EPSS, and the number quoted to justify it is that ranking by EPSS covers the same share of real-world exploitation for a fraction of the patching effort.

Problem

That comparison scores a forecaster against data it has already seen: EPSS is trained on exploitation signals and the KEV catalogue *is* the exploitation ground truth. Nothing in the usual presentation separates genuine forecasting skill from hindsight, so the number that drives real remediation budgets had never been tested prospectively here.

Approach

  • Reproducible pipeline over three public feeds — the CISA KEV catalogue, EPSS daily scores and the complete NVD taken from the fkie-cad mirror rather than the paginated API, which turns a multi-hour crawl into a 12-second download.
  • Ties are averaged, never broken. Tens of thousands of CVEs share a CVSS base score of exactly 9.8, so letting `sort` settle the order inside that block measures the alphabetical order of CVE identifiers. Each block is scored as its expected value under uniformly random ordering — guarded by a test that ships with a negative control.
  • The honest re-run: EPSS frozen at five past dates, the universe rewound to the CVEs that existed then, and only the vulnerabilities CISA confirmed exploited *afterwards* counted as positives.
  • Uncertainty bootstrapped over the positives — 2,000 resamples with a pinned seed — because with 86 to 143 confirmed-exploited CVEs per cutoff, that small number is where the sampling noise lives, not in the 300,000-row universe. The random baseline is always plotted; without it the two curves have no scale.
  • Four dashboard views, each answering the question printed at the top of it — no chart exists for decoration — plus CSV export of the queue, which is the artefact a stakeholder actually asks for.

Impact

  • Reproduces the industry claim exactly: ranking 359,399 live CVEs by CVSS needs 137,952 patches to cover 80 % of confirmed exploitation, against 22,736 by EPSS — a 6.1× advantage.
  • Then dissolves most of it. With scores frozen, EPSS still wins at the head of the queue (1.2–1.8× the later-exploited CVEs caught at equal budget) but *loses* on the long tail, needing more work than CVSS to reach 80 % coverage — effort ratio 0.5–0.7×. The direction holds at all five cutoffs.
  • The dashboard ships the policy the measurement argues for rather than the headline: confirmed exploitation first, ransomware use above the rest, then forecast probability, with CVSS kept as the guard on the tail.
  • Four limitations — KEV's own bias, unfrozen CVSS scores, small positive counts and post-cutoff exclusions — are stated in the README rather than buried, including the one that cuts against the finding.
  • The patch queue view: CVEs ranked by the hybrid policy, filterable by vendor, severity and exploit probability, with CVSS shown alongside rather than driving the order.
  • The finding with its evidence: effort-versus-coverage curves for CVSS and EPSS against a random baseline, then the same comparison with the scores frozen and judged only on what was exploited afterwards.
  • Remediation SLA view: CISA's BOD 22-01 deadlines drawn from seventeen fixed windows, with a slider that runs the queue at a chosen remediation rate and reports the cost in overdue days.
  • Catalogue composition: which vendors and weakness classes dominate the KEV catalogue, and when CISA added each entry.
6.1×EPSS advantage, as usually measured
0.5–0.7×the same advantage, measured honestly
359,399live CVEs ranked
1,665KEV entries as ground truth
2,000bootstrap resamples
76tests · 5 ADRs
  • Hybrid queue: confirmed exploitation → ransomware use → EPSS, CVSS as tail guardImplementedSecurity
  • BOD 22-01 remediation SLA view with a capacity slider costed in overdue daysImplementedSecurity
  • Tie-averaged effort/coverage metric, guarded by a test with a negative controlImplementedResilience
  • Frozen-score prospective evaluation over five cutoffs with bootstrapped 95 % CIsImplementedResilience
  • Committed data contract: schema tests fail the build if a feed changes shapeImplementedResilience
  • CSV export of the patch queue for stakeholdersImplementedUX

Stack

  • Python 3.12
  • pandas
  • NumPy
  • Streamlit
  • Plotly
  • PyArrow
  • pytest
  • Make
  • CISA KEV
  • EPSS
  • NVD

GOATGuard

Flutter mobile client for network monitoring & security, with full TOTP 2FA.

Role
Author — mobile client architecture, auth/2FA flows, state & services.
Context
Small networks — home offices and SMEs — lack an accessible mobile interface to visualize connected assets, link health and security alerts without deploying enterprise-grade NMS infrastructure.

Problem

Existing solutions are either enterprise-tier (expensive, complex) or consumer tools with no security posture visibility. There was no lightweight mobile client that combined real-time network monitoring with hardened authentication.

Approach

  • Network health dashboard with device inventory classified by type (routers, printers, cameras, etc.).
  • Security alert feed with severity levels, including port-scan detection.
  • Full TOTP 2FA flow: QR enrolment, login verification, backup codes and account recovery.
  • JWT stored in OS secure storage (Keystore/Keychain) with a global 401 interceptor for session management.
  • WebSocket architecture with exponential backoff reconnection for real-time data streams.

Impact

  • 14-screen mobile application with 5-tab architecture delivering a complete network security management experience.
  • 3-factor account security (TOTP + backup codes + recovery) backed by OS-level secure storage.
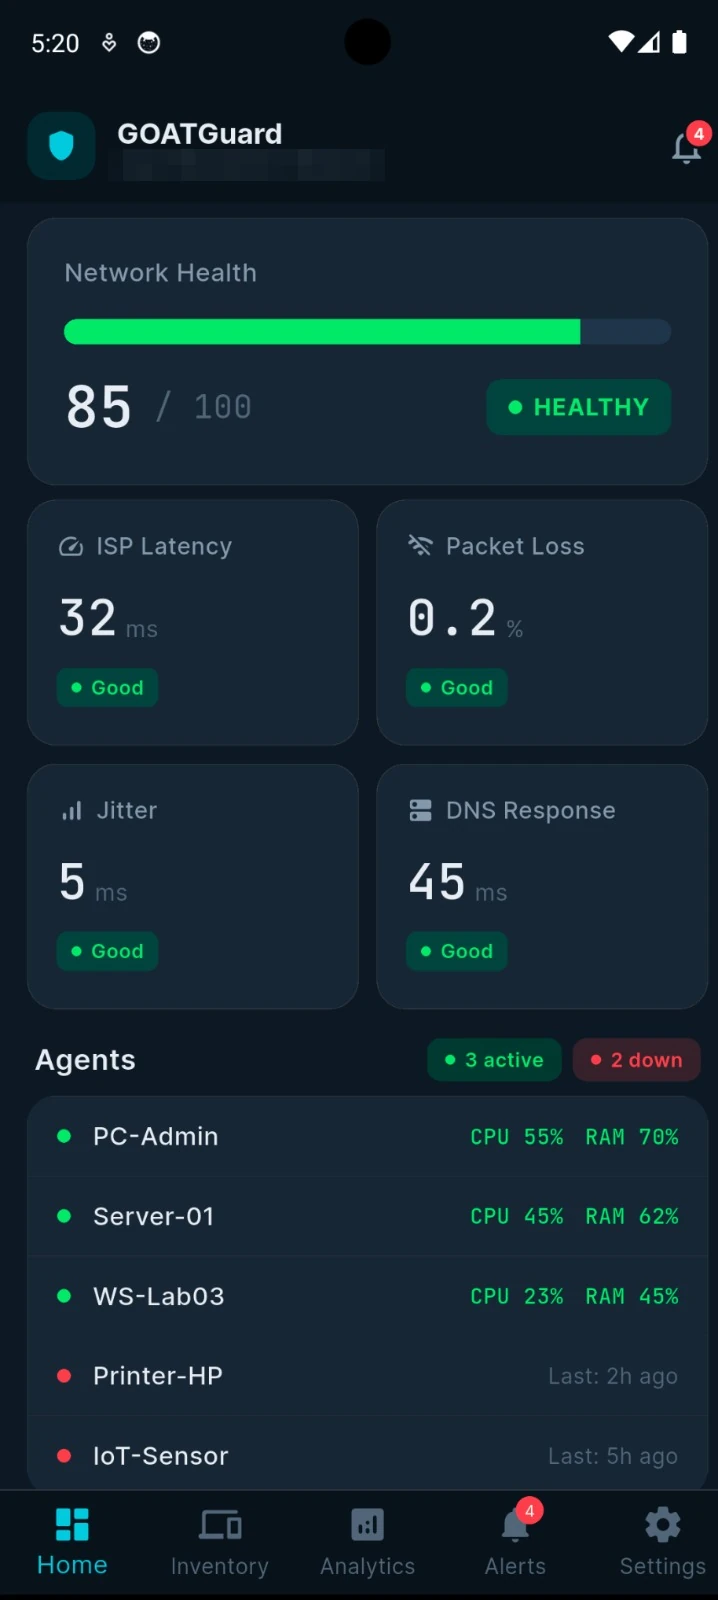
  • Home dashboard: network health score 85/100 with ISP latency, packet loss, jitter and DNS response cards, plus the agent list with live CPU/RAM per device.
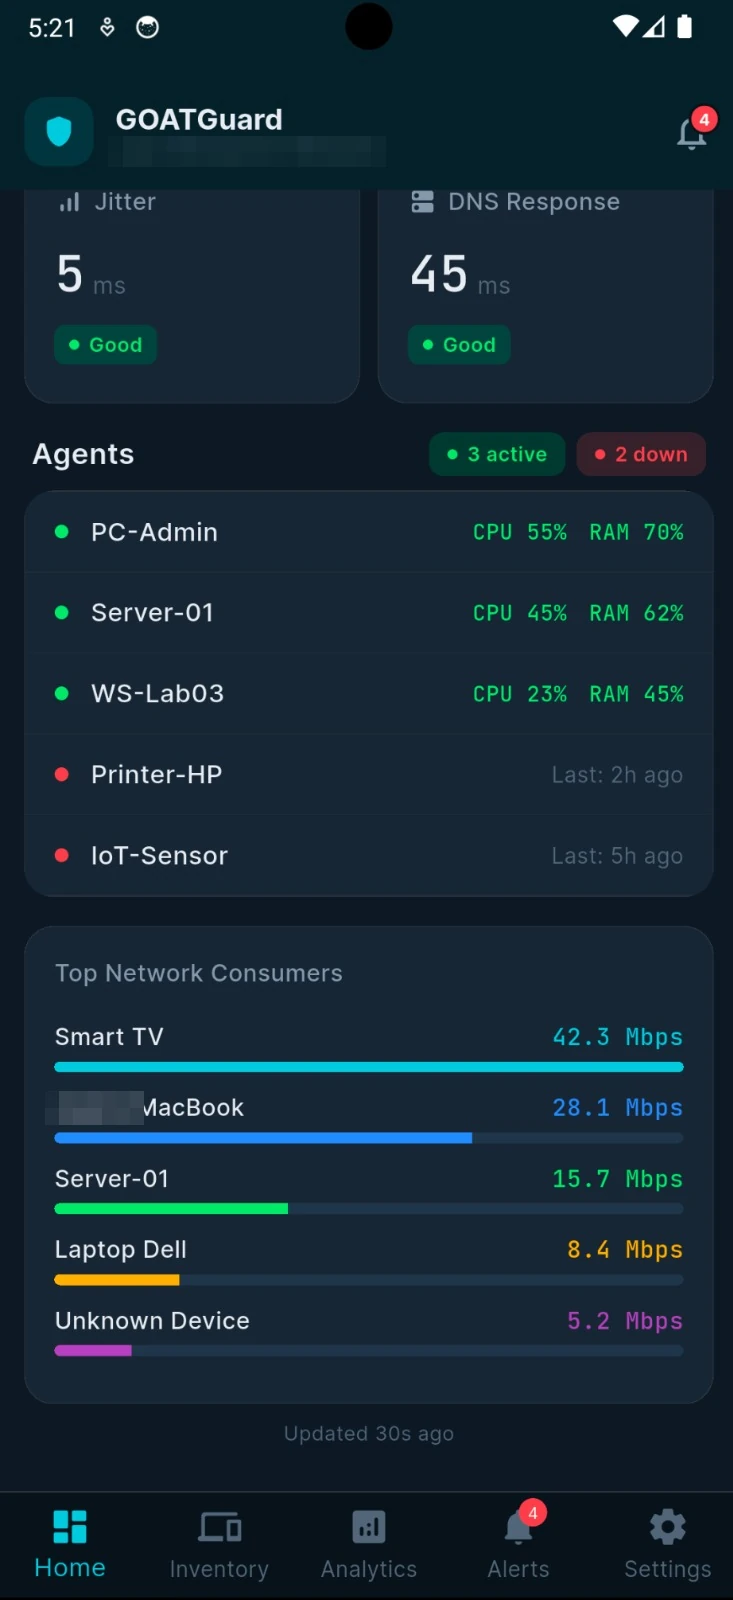
  • Top network consumers ranked by bandwidth (Mbps) alongside agent status, updated every 30 seconds over WebSocket.
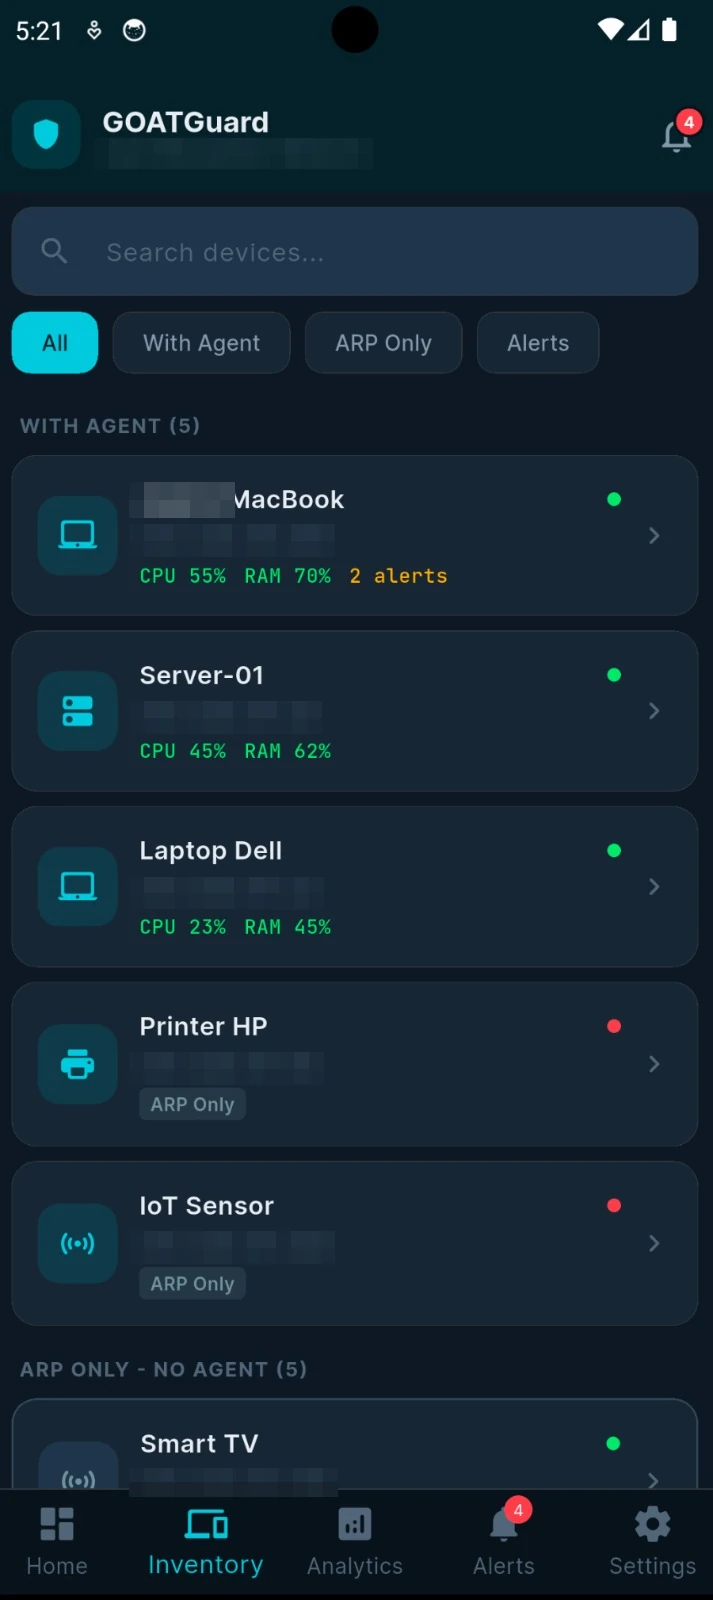
  • Device inventory with search and filters, split between devices with an installed agent and ARP-only discoveries; sensitive addresses redacted.
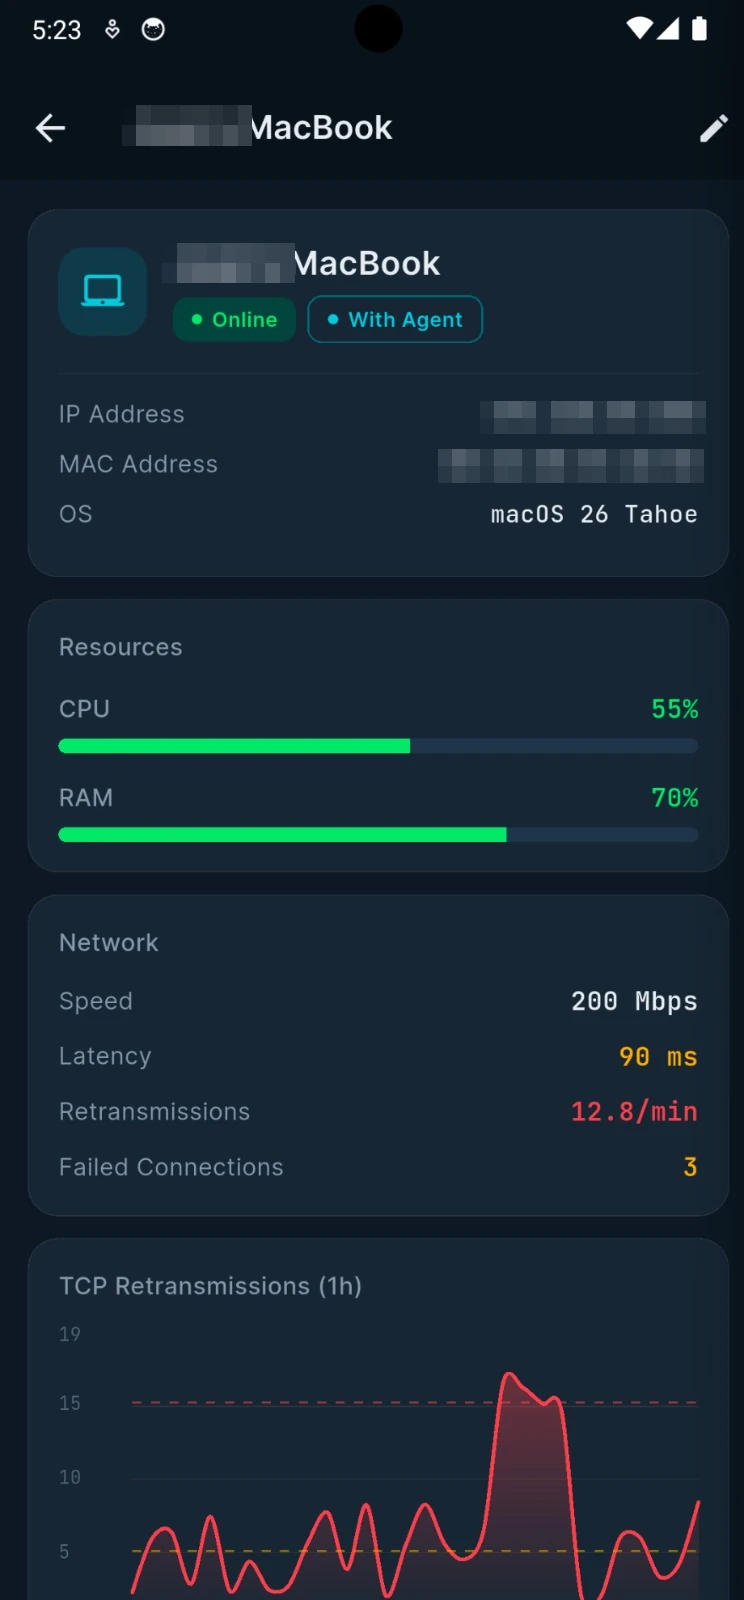
  • Device detail: identity (IP/MAC redacted), OS, live CPU and RAM gauges, and network KPIs like speed, latency and TCP retransmissions.
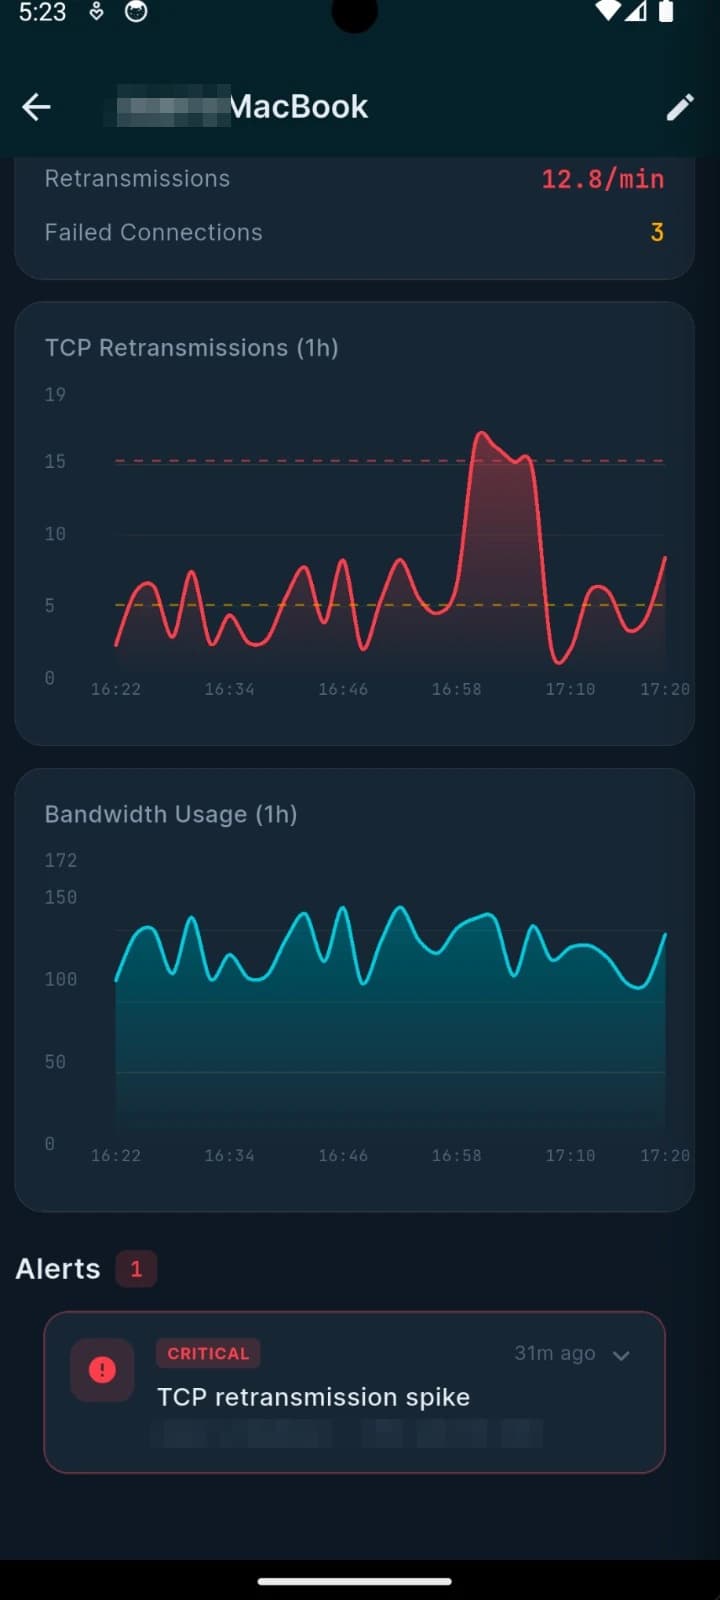
  • Per-device time-series charts (fl_chart): TCP retransmissions with thresholds and hourly bandwidth usage, plus a critical retransmission-spike alert.
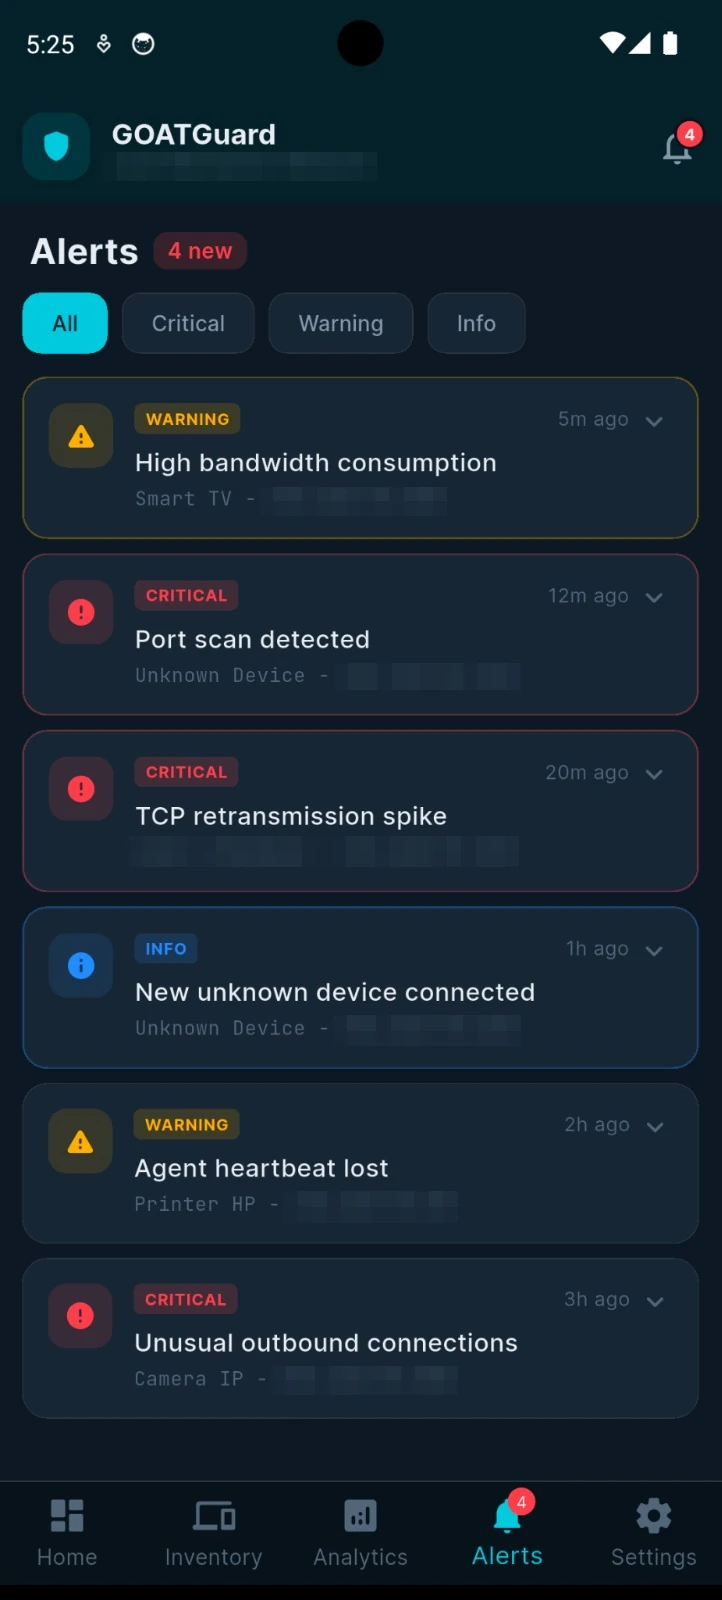
  • Security alert feed with severity filters: port-scan detection, unknown device joins, heartbeat loss and unusual outbound connections.
  • 2FA enrolment: one-time recovery code screen (code redacted) shown before TOTP setup, with explicit save confirmation required to continue.
  • Ten single-use backup codes (redacted) generated after TOTP setup, with copy-all action and save confirmation gating access to the dashboard.
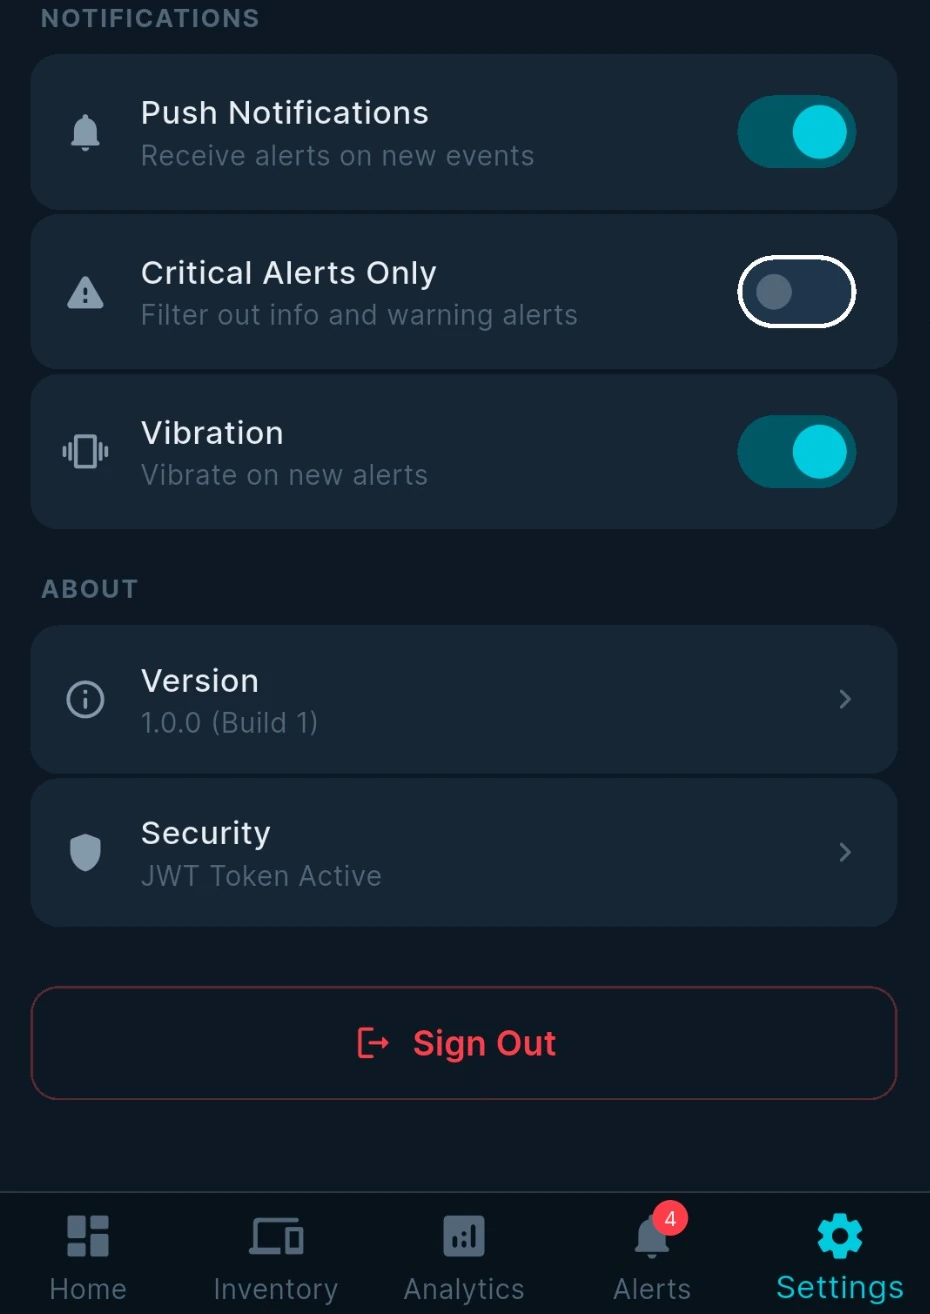
  • Settings: notification preferences and security section showing the active JWT session, with sign-out.
6.6Klines of Dart
3account-security factors
20+REST endpoints
14screens (5-tab arch)
  • TOTP 2FA: QR enrolment, login verification, backup & recovery codesImplementedSecurity
  • JWT in OS secure storage (Keystore/Keychain) + global 401 interceptorImplementedSecurity
  • Real-time dashboard architecture (REST + WebSocket)Demo / backend-readyResilience
  • WebSocket reconnection with exponential backoffImplementedResilience
  • Time-series chartsSimulated dataUX
  • Push notificationsSimulated dataUX

Stack

  • Flutter
  • Dart
  • Provider
  • Dio
  • web_socket_channel
  • flutter_secure_storage
  • qr_flutter
  • fl_chart

AWS High-Availability Infrastructure

Three-tier architecture across two availability zones, entirely codified in Terraform and deployed by a pipeline that never runs Terraform in the hot path.

Role
Sole author — architecture, Terraform modules, application service, CI/CD pipeline, load testing and the written decision record.
Context
Final evaluation for Infrastructure Design & Management (UPB) with a concrete deliverable rather than a diagram: a running service that keeps serving when an availability zone is lost, reproducible from source on an AWS Academy sandbox whose credentials expire every four hours.

Problem

High availability is easy to draw and hard to prove. The architecture had to survive an AZ failure visibly, keep the database unreachable from the internet and from the load balancer alike, and redeploy on every push without a human holding Terraform state — all inside an account that forbids creating IAM roles.

Approach

  • VPC spanning two availability zones with public and private subnets separated by role: the load balancer and NAT gateway sit in public subnets, the application instances and the database in private ones.
  • Auto Scaling Group pinned to a minimum of two instances, one per AZ, with the ALB's HTTP health check — not the EC2 status check — as the source of truth for application health.
  • Least-privilege security groups in a strict chain: the ALB accepts the internet, the app tier accepts only the ALB, and the database accepts only the app tier and has no egress at all.
  • RDS PostgreSQL Multi-AZ with encrypted gp3 storage, public access disabled, credentials generated with `random_password` and marked sensitive so they never reach the repository.
  • Deployment without Terraform in the hot path: GitHub Actions lints, tests, builds the image and pushes it to ECR, then triggers an ASG instance refresh. Terraform provisions; the pipeline only rolls instances.
  • k6 load tests read against CloudWatch — request count, target response time, healthy host count and 5XX rate — so the balancing claim is measured rather than asserted.

Impact

  • The whole stack — VPC, internet and NAT gateways, ALB, Auto Scaling Group, ECR, RDS Multi-AZ, security groups, CloudWatch dashboard and alarm — reproduces from a single `terraform apply`.
  • Trade-offs documented with their cost rather than presented as best practice: one NAT gateway instead of one per AZ (~$32/month each, with the failure mode written down), EC2 + ASG instead of Fargate because losing an instance is visibly survivable, and Multi-AZ instead of a read replica because failover mattered more than read capacity.
  • Three independent workflows keep the repository honest: CI on the application, CD to ECR and the ASG, and a Terraform plan that runs on pull requests.
  • AWS architecture diagram: an internet-facing ALB in two public subnets forwarding to EC2 instances in private subnets across both availability zones, backed by a Multi-AZ RDS PostgreSQL instance, with ECR and CloudWatch alongside.
2availability zones
3tiers (web / app / data)
3CI/CD workflows
0database ports open to the internet
  • Least-privilege security-group chain; the database has no egress and no public accessImplementedSecurity
  • Encryption at rest on RDS; passwords generated in Terraform and marked sensitiveImplementedSecurity
  • Multi-AZ failover with the ALB health check as the source of truthImplementedResilience
  • Zero-touch redeploy via ECR push + ASG instance refreshImplementedResilience
  • ECR scan-on-push and a lifecycle policy capping stored imagesImplementedSecurity
  • CloudWatch dashboard and 5XX alarm, exercised under k6 loadImplementedResilience

Stack

  • Terraform 1.6+
  • AWS VPC / ALB / ASG / EC2
  • RDS PostgreSQL 15 Multi-AZ
  • Amazon ECR
  • CloudWatch
  • FastAPI
  • SQLAlchemy 2.0
  • Docker
  • GitHub Actions
  • k6

Autonomous Market Intelligence System

Event-driven market pipeline where the interesting engineering is the governance layer that can refuse to trade — and currently does.

Role
Sole author — governance engine, ML pipeline, event-driven runtime and test suite. Private repository; walkthrough available on request.
Context
A long-running system that ingests market data, news and SEC filings, forms a view with a machine-learning ensemble and a multi-agent analyst desk, and can place bracket orders on Alpaca's paper-trading account. Stocks and crypto, on a fixed daily schedule plus continuous streaming.

Problem

Anything that can send an order autonomously is only as safe as the thing that can stop it. The hard part was never the model — it was building a layer that refuses signals it cannot justify, escalates the ambiguous ones to a human, and keeps the whole system away from real money until the numbers earn it.

Approach

  • A governance engine with seven risk checks and a portfolio drawdown circuit breaker sits between every signal and the broker: high confidence executes, medium confidence goes to a Telegram inline keyboard and expires unanswered after 30 minutes, low confidence is refused outright.
  • Walk-forward validation with an expanding window and a purged 21-day gap; an ensemble of XGBoost, RandomForest and LogisticRegression with Platt calibration — isotonic was replaced because it collapsed the probabilities — and Optuna tuning every three folds.
  • Forty engineered features spanning price action, volatility, market regime and FinBERT news sentiment, with dynamic feature selection above an importance floor.
  • Event-driven runtime: an asyncio pub/sub bus over thirteen event types, three WebSocket streams with exponential-backoff reconnection and circular tick buffers, and a scheduler running eight jobs.
  • A GO/NO-GO gate that has to pass before any real capital is considered: at least 30 trades over 90 days, 55 % win rate, Sharpe ≥ 1.0, max drawdown ≤ 15 % and ML accuracy ≥ 55 %.

Impact

  • 505 automated tests across seventeen suites, weighted towards the parts that can lose money: governance, execution, calibration, reconciliation and the streaming layer.
  • The current state is reported rather than dressed up: the ensemble sits at 52.9 % accuracy against a 55 % gate, so the system is deliberately not cleared for live capital and runs on paper only.
  • Every prediction is written back and validated against what actually happened, so model accuracy is a measured series rather than a training-time claim.
505tests across 17 suites
7risk checks before any order
40engineered ML features
52.9%ML accuracy
13event types on the bus
3WebSocket streams
  • Governance engine: 7 risk checks plus a portfolio drawdown circuit breakerImplementedSecurity
  • Human-in-the-loop approval over Telegram, expiring after 30 minutesImplementedSecurity
  • GO/NO-GO gate blocking live capital until the metrics holdImplementedSecurity
  • Walk-forward validation with a purged gap and Platt calibrationImplementedResilience
  • WebSocket streaming with exponential-backoff reconnection and fallback providerImplementedResilience
  • Live trading with real capitalSimulated dataSecurity

Stack

  • Python 3.14
  • XGBoost
  • scikit-learn
  • Optuna
  • FinBERT
  • CrewAI
  • DuckDB
  • ChromaDB
  • aiohttp
  • APScheduler
  • Alpaca API
  • Telegram Bot API
  • Streamlit